
Artemundi Global Fund’s Up-to-Date Information (2010-2015) FINAL
“Successful Last Year of Operations, AGF Winds-Up”
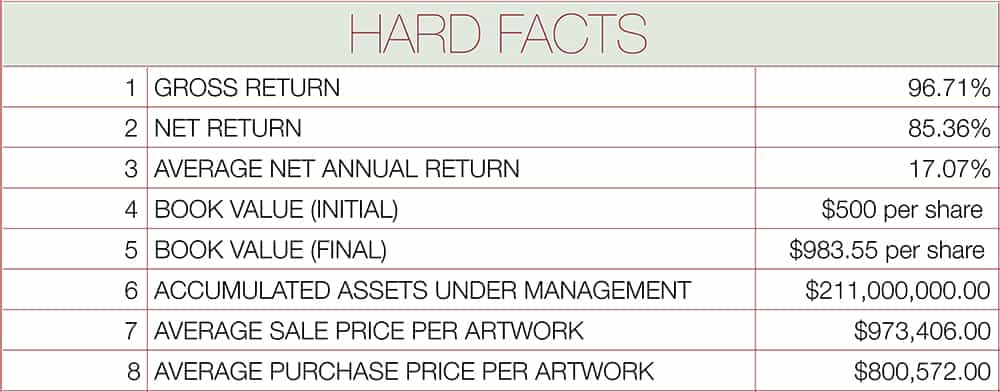
Artemundi Global Fund (“AGF”), the first art fund managed by Artemundi Management Limited finished operations on April 30th 2015 after 5 successful years. The challenges were great, but the overall results were even greater than expected. The Fund carried out $161,365,136.00 USCy in transactions.
Book Value per Share & Return per Share
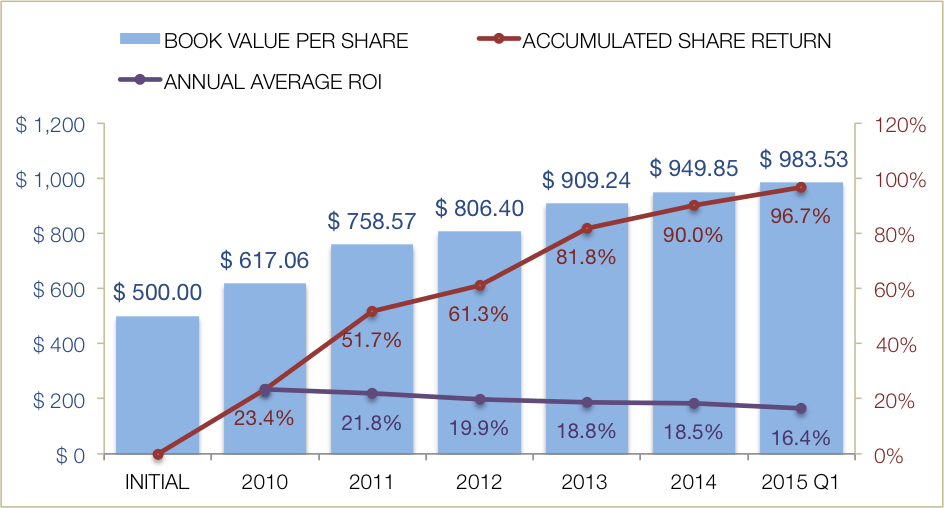
The book value per share has increased from an initial value of $500 USCy at establishment to $983.53 USCy, an accumulated return of 96.7%. The approximate 17% increase per operation year has augmented consistently. Nevertheless, the annual increase in value appears to go lower. This is due to the fact that inventories acquired at a discount have a greater effect at their initial Art-to-Market valuation. Logically, as unsold inventory ages, the valuation at the end of each fiscal year has a lesser impact than when the artworks are first added to the portfolio, or when sold at Fair Market Value (FMV) at a later time. Furthermore, the appearance of a sluggish, however ever-amassing, increase in value per share can also be explained by the fact that a large share of the Art Inventory has been held for appreciation since the fund’s inception and continues to increase in value but at a decreasing rate.
Art-Portfolio Diversification
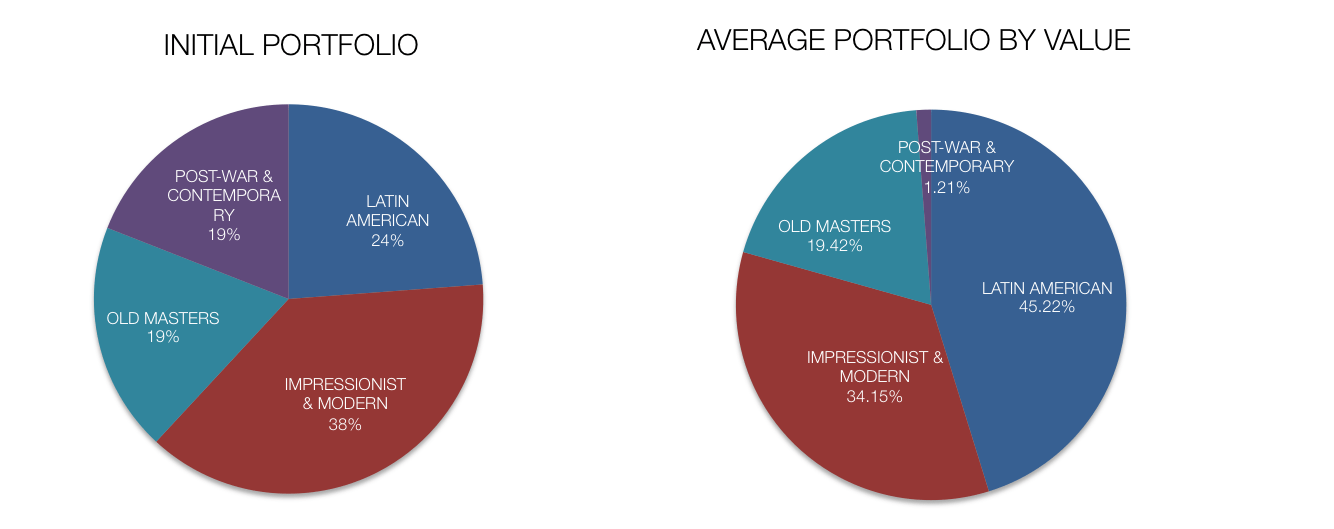
Akin to any investment portfolio, AGF’s assets are diversified in different art sectors in order to minimize investment risk. Since every art sector has a different risk-return ratio, every artwork is methodically evaluated to consider its overall impact on the art portfolio. The optimal share of each art category is weighted according to current market tendencies by analyzing diverse sources of qualified information and industry acumen. Specifically, the Latin-American Art sector represents a substantial part of the portfolio because experience has demonstrated very high-quality artworks are frequently undervalued, and thus represent highly remunerative investment opportunities.
Inventory Transactions
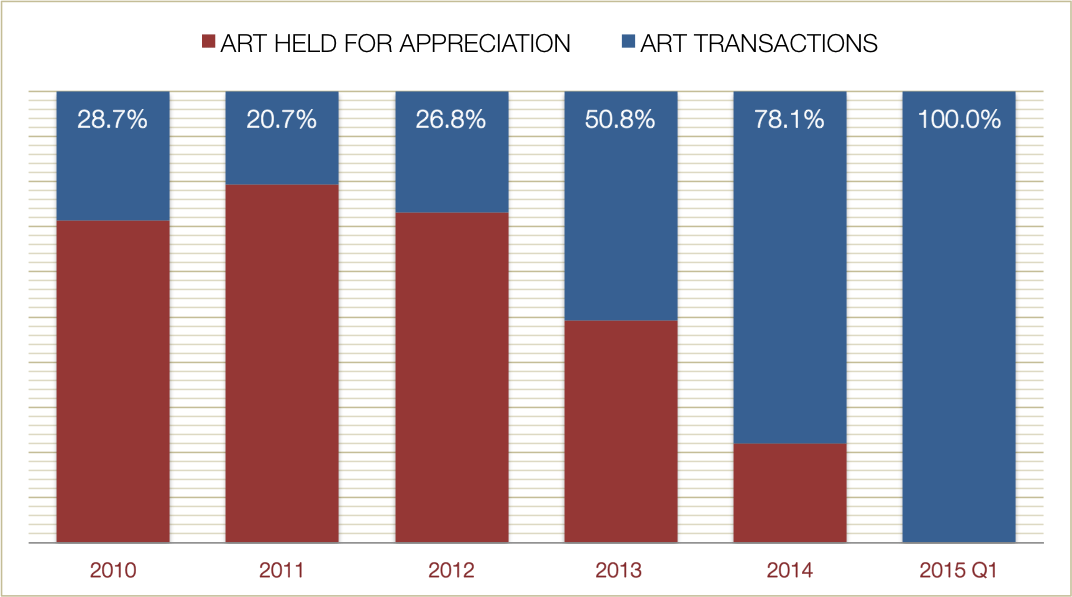
This ratio indicates the total share from the portfolio that was involved in transactions in each corresponding year. It represents the share of artworks that were either bought or sold relative to the total art portfolio. The rest of the artworks in the portfolio were held for longer-term appreciation. Once again, the 2013 and 2014 numbers confirm the disinvestment process, showing that the share of art transactions decreased in relation to the previous years. The art held for appreciation by the end of 2014 was minimum in anticipation of the fund’s termination and it disappeared completely during 2015.
Sources of Profit
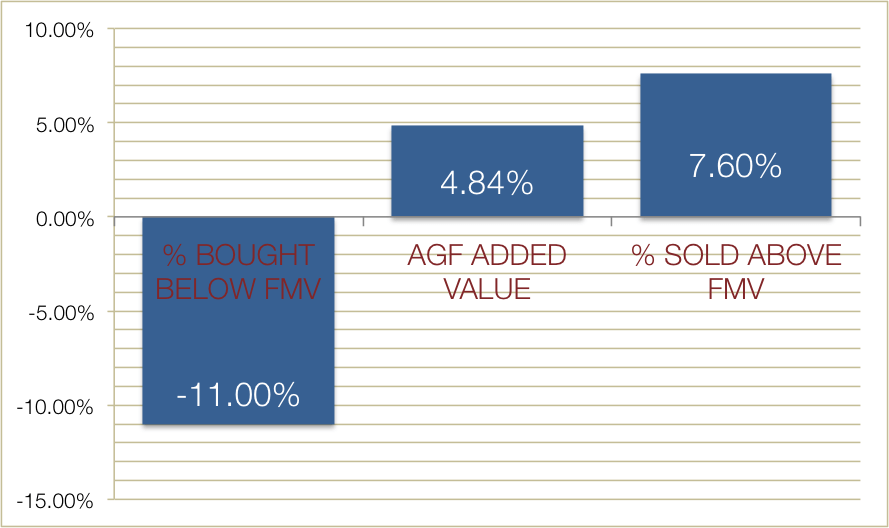 On average, our artworks have been acquired 11% below their Fair Market Value (FMV) and sold up to a maximum of 7.6% above FMV. AGF’s institutional character and reputation in the industry has garnered significant negotiation power to purchase artworks at a competitive discount (we can provide perfectly discreet transactions and fast cash to sellers). The sale of artworks at essentially at their FMV encourages transparency in the industry and generates trust with our clients. The commitment to sell fair indicates that majority of return is achieved at purchase, but also by capabilities of creating and adding value to artworks via restoration, improvements to condition and presentation, establishing acclaim and visibility by lending to museums and/or important collections, enabling academic or expert studies to be included in books, catalogues and significant academic publications. Our objective is to offer high-quality, properly-inspected and fairly-priced artworks to the market.
Artemundi Global Fund is not just a portfolio of artworks; it is a fully integrated commercial organization, capable of creating value in ways beyond passive ownership or opportunistic transactions.
Sale Price Distribution
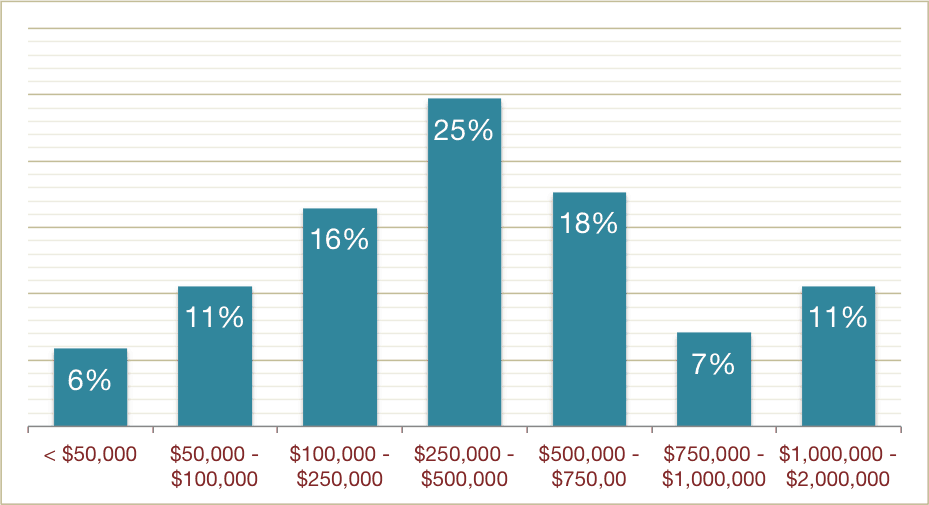 The prices of sold artworks appear to have a normal distribution curve, where 25% of the assets were sold in a median price range of $250,000 to $500,000 USCy. Only 11% of the artworks have been sold above $1 million dollars USDy and 6% below $50,000 USCy.
Transactional Price Averages
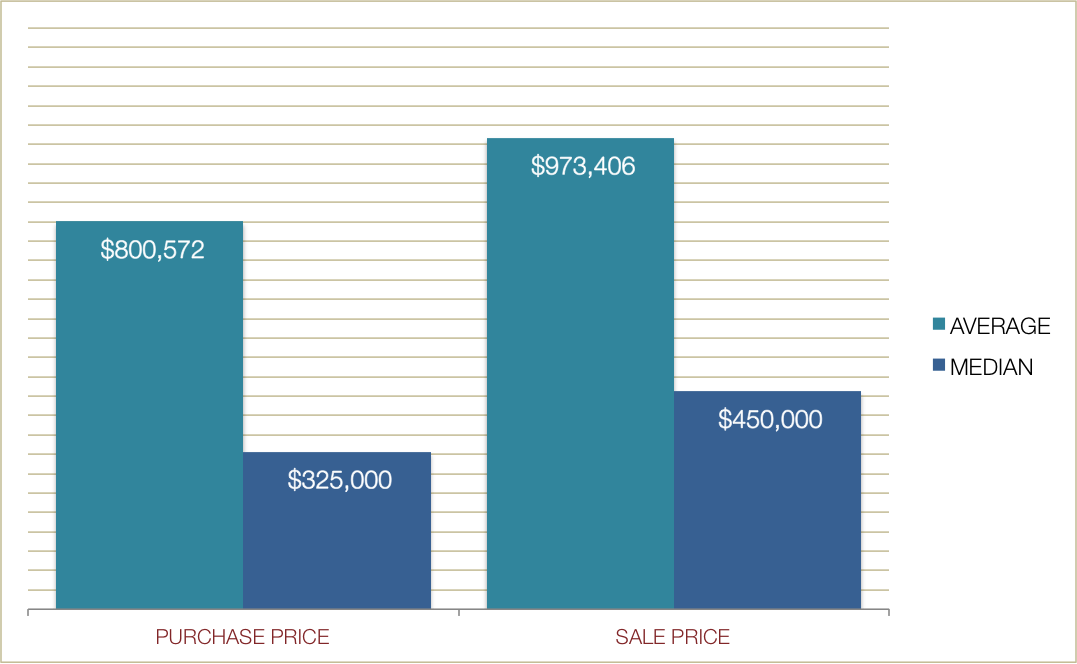
Market analysis and the manager’s experience, helped us determine the optimal price range of transactions lies between $250,000-$750,000. This price range has proven to be a profitable and liquid art market sector where administration costs are kept at a minimum. Lower price levels can be very profitable, however the cost of managing a much larger portfolio (mostly manpower and logistics) comprises the efficiency of art transactions and the risk of loss increases.
Expense Ratio
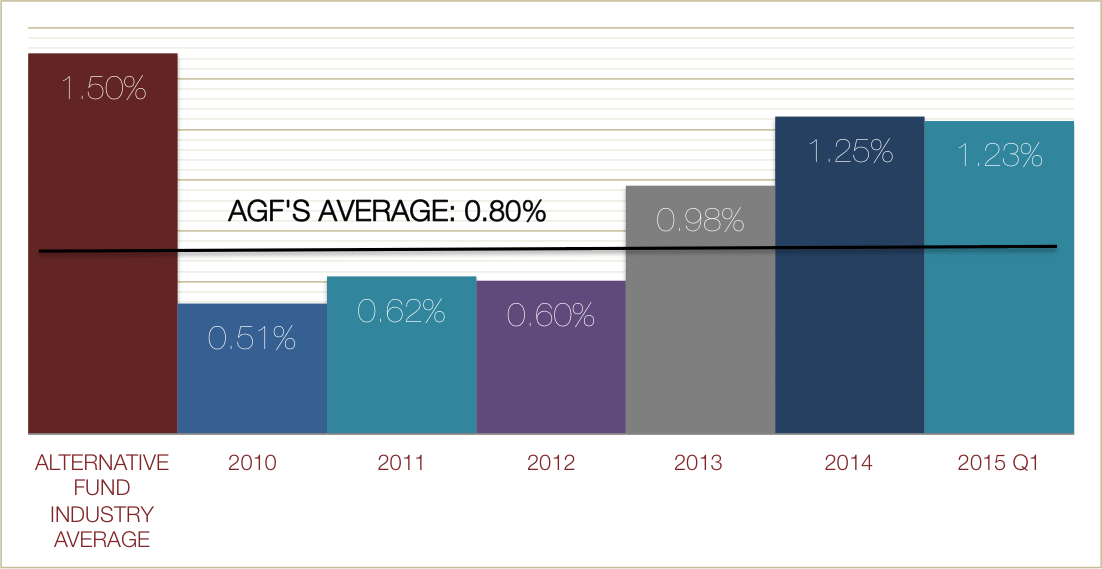 One of AGF’s the fundamental principles of has been to maintain minimal operational costs to maximize on returns. Calculated by dividing the total operating expenses by the total assets under management, the Expense Ratio to date averaged 0.80%, a lower ratio than most alternative investment funds.
Average Commission Fee
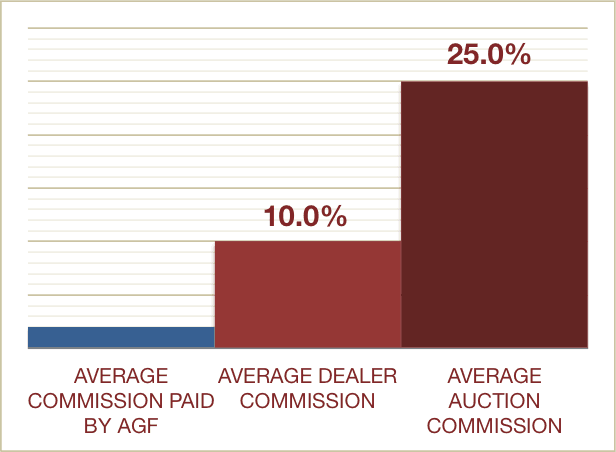 In line with AGF’s golden rules, transaction costs have been kept at a minimum throughout the Fund’s operation. In order to avoid the 25% average commission fee charged by auction houses, AGF’s strategy focuses on engaging in private sales with private collectors to keep commissions very low and maximize the returns achieved from art transactions. The average commission fee paid overall has been as low as 2% per transaction, though satisfactorily 66% of the transactions did not pay any commission at all.
Transaction Facts
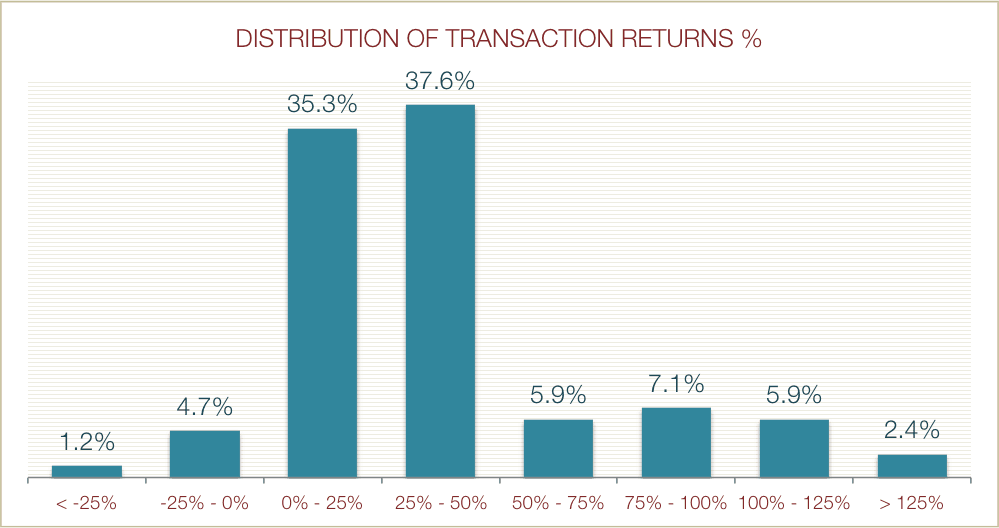
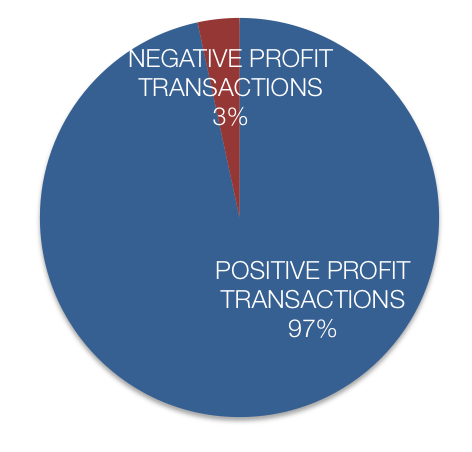
These graphs show the distribution of the transaction returns. 37% of the transactions had a return between 25-50% (sometimes over a several year period). Only around 5% of the transactions had a negative return. If calculated by transaction value, 97% of the sales achieved a positive profit and only 3% accounted for losses. Most of the losses were from artworks that had to be acquired on a “package deal” and had to be disposed off.
Zero Cost of Debt

Stockholders mostly finance AGF’s net value; investors have owned on average 98.7% of AGF’s equity. Only around 1.21% of our financing comes from short term payables. From the capital stock in the equity, an average of 47.89% corresponded to Preferred Shareholders and 52.11% to the Partner Capital. Some inventories turnover before the fund had actually paid for them. This form of inventory financing is often used by retailers using 30-60-90 days methods, not unusual to the art market.
Profit per Sector
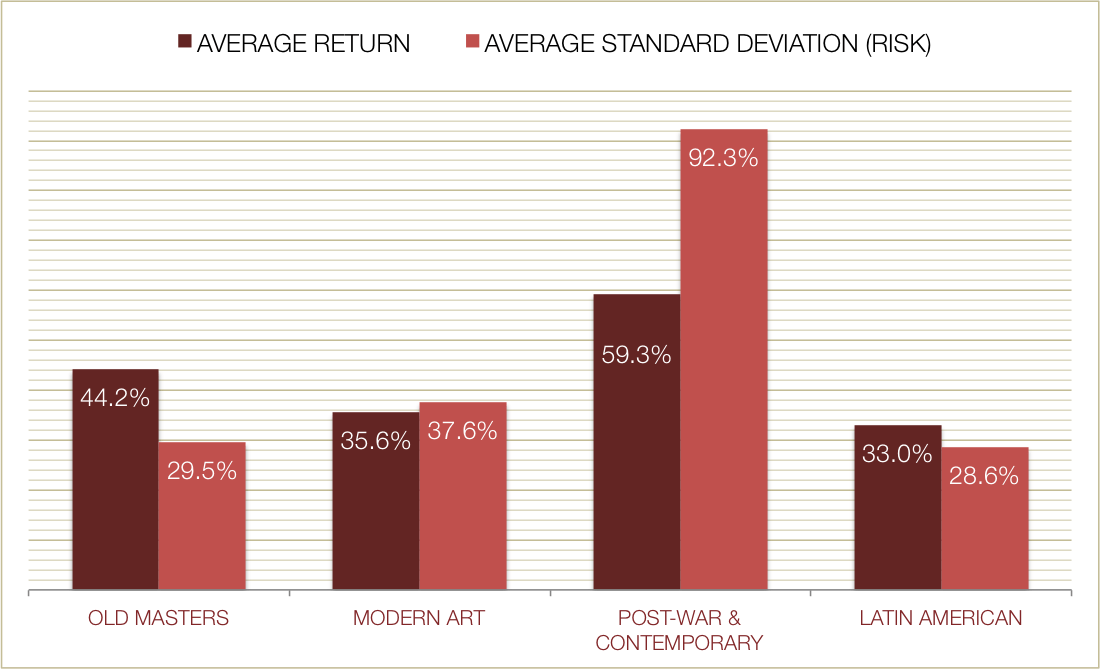
This graph illustrates the average transaction return and the standard deviation. The Post-War & Contemporary segments yield very attractive returns, but with high volatility.
Transaction Days
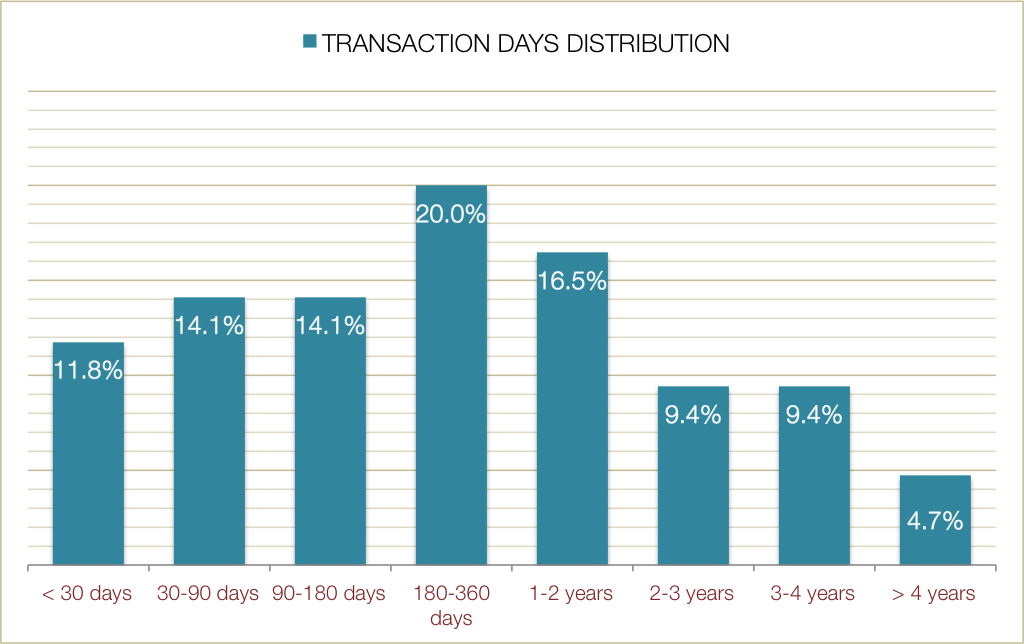
This graph illustrates the transaction period distributions, implying that 20% of the transactions were closed between six months and a year. Very few artworks (only 4.7%) remained for more than 4 years in the portfolio.
Return on Sales
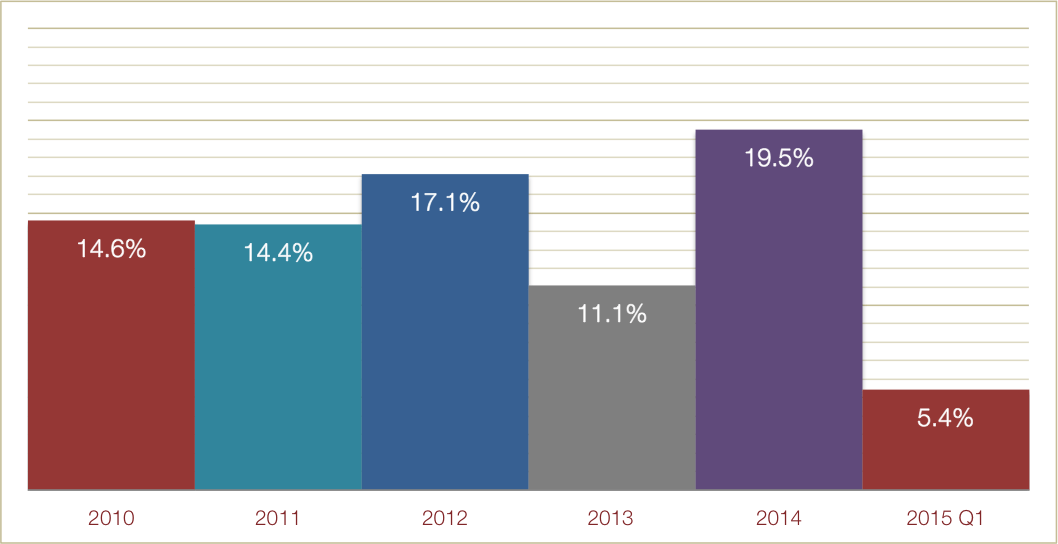
Return on Sales (ROS) is the operating income as a percentage of the sales revenue. It indicates how profitable the operations are without considering the capital or assets invested. This ratio does not consider the income generated by the art-to-market appreciation. It is simply calculated by dividing the Operating Income by the Total Sales Revenue. On average, the ROS has been 13.7% though the Fund’s life.
Return on Assets
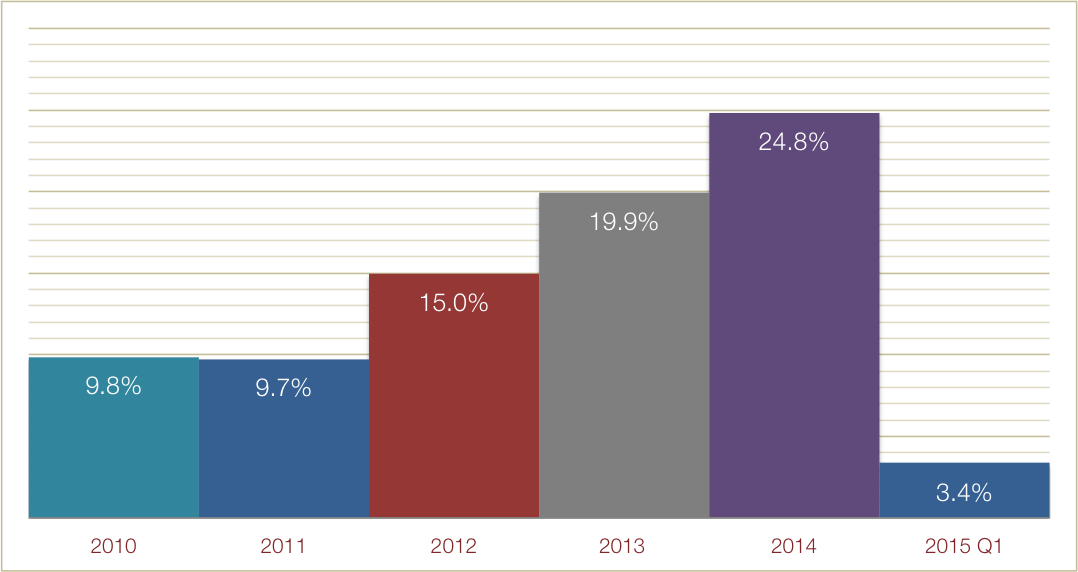
Return on Assets is an indicator of how profitable a company is relative to its total assets. It gives an idea on how efficient the management is at using its assets to generate earnings. It is calculated by dividing a company’s annual earnings by its total assets. On average the ROA has been 13.7% though the Fund’s life.
Return on Equity
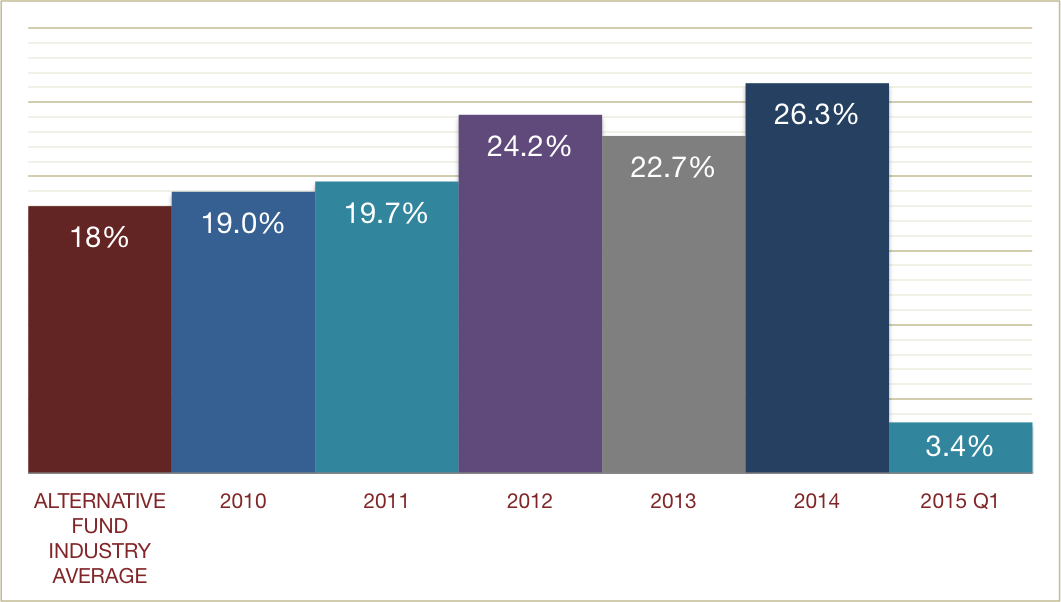 The ROE calculates the total net income as a percentage of the equity to measure the Fund’s efficiency generating profits from every unit of shareholders’ equity. This equity ratio is very high for art funds because of the art inventory’s Art-to-Market appreciation. During 2014, the Return on Assets (ROA) —NOT SHOWN ON THIS GRAPH— was calculated at 24.7%, the highest since the Fund’s inception. This is owing to successful co-investments fully managed by AGF that minimized risk and provided succulent returns with minimal resources. Correspondingly, the Return on Sales (ROS) was computed at 19.5%